E-Commerce6 min read
What Is Contribution Margin? Formula, Examples, and Why It Matters
Understand how contribution margin helps e-commerce brands evaluate product profitability, control marketing spend, and scale sustainably.
Understand how contribution margin helps e-commerce brands evaluate product profitability, control marketing spend, and scale sustainably.

If there’s one metric your eCommerce brand should obsess over beyond total profitability, it’s contribution margin (CM).
Contribution margin tells you how much money your products actually generate after covering the costs directly tied to selling them. It provides insight into pricing, marketing efficiency, product viability, and overall business health.
For growing DTC brands, contribution margin often matters more than surface-level metrics like revenue or even ROAS.
Contribution margin measures profitability at a unit or product level.
It is calculated as:
Revenue – Discounts – Refunds – Returns – Cost of Goods Sold (COGS) – Marketing Costs = Contribution Margin
In simple terms, contribution margin equals your gross margin minus variable costs.
This metric shows how much money remains to cover fixed costs and eventually generate profit.
Contribution margin is also a key input in calculating your Break-Even Point (BEP).
No.
Contribution margin removes variable costs but does not account for fixed expenses such as:
Salaries
Rent
Insurance
Depreciation
Software subscriptions
Net profit is what remains after both variable and fixed costs are deducted.
Contribution margin tells you how much money each sale contributes toward covering fixed costs and generating profit.
Before calculating CM, it’s important to distinguish between cost types.
Variable costs fluctuate with production and sales volume. These include:
Marketing expenses
Shipping and fulfillment
Billable labor
Raw materials
Production costs
Transaction fees
Utilities (if usage-based)
These costs increase or decrease depending on how much you sell.
Fixed costs remain consistent regardless of how much you sell. Examples include:
Rent
Insurance
Salaries
Equipment depreciation
Even if you sell zero units, fixed costs remain.
Some costs may fall into gray areas, so consistency in classification is important for accurate CM tracking.
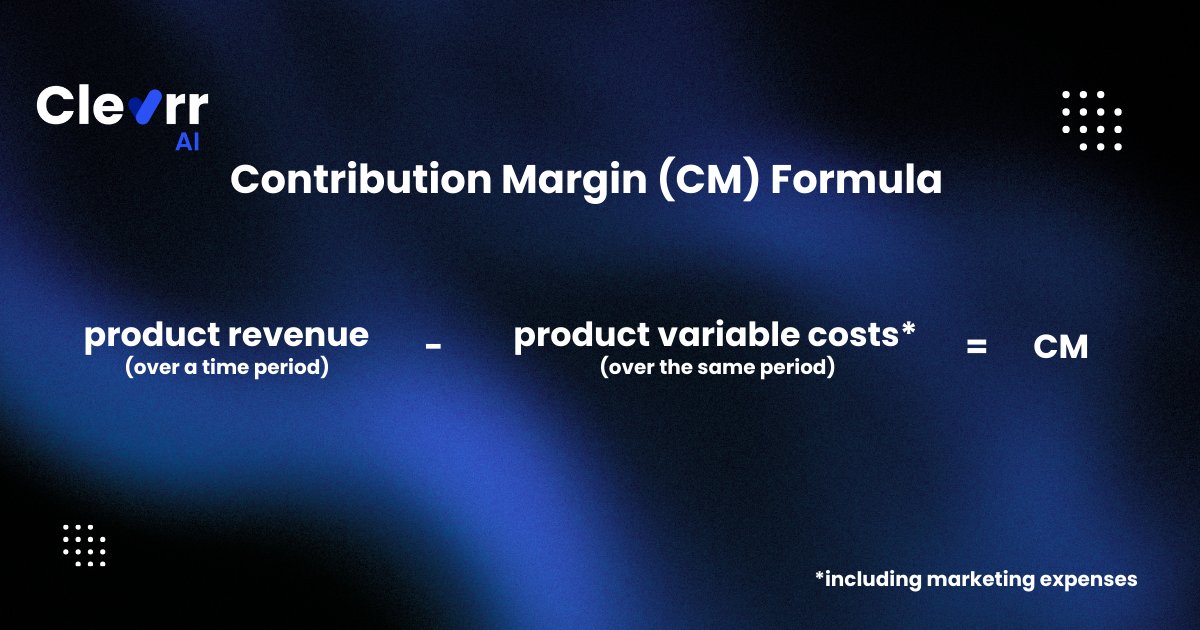
You can express CM as a dollar value or as a percentage.
Revenue – Variable Costs = Contribution Margin
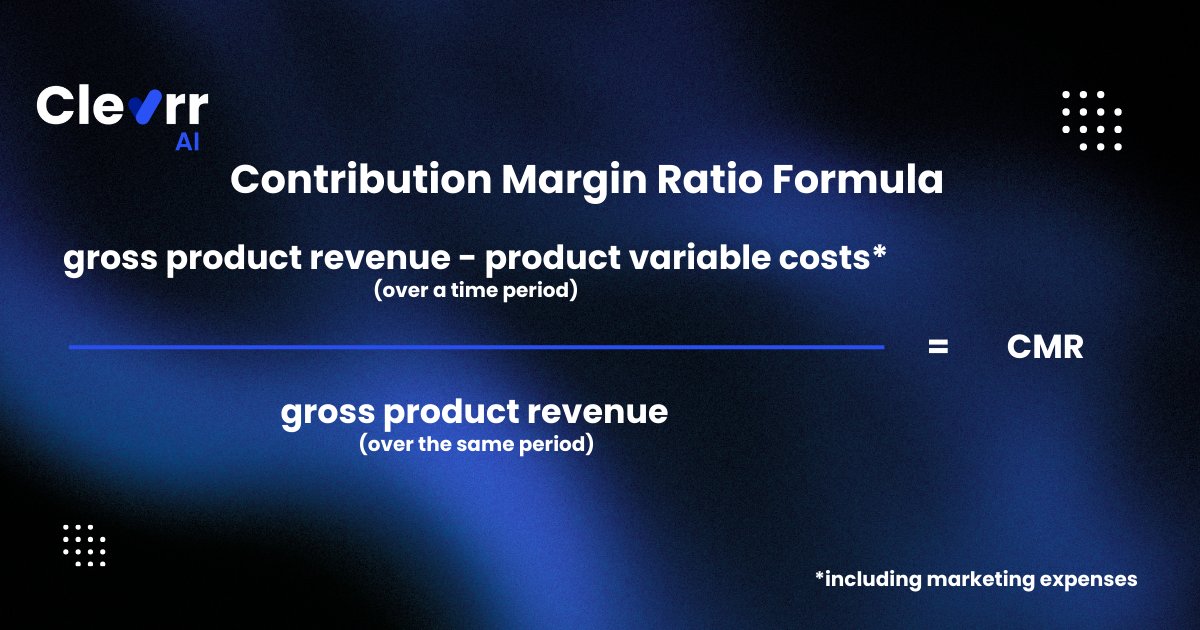
(Revenue – Variable Costs) ÷ Revenue
Example:
You sell a hat for $10.
Your variable cost per unit is $5.
Contribution margin ratio:
(10 – 5) ÷ 10 = 0.5 or 50%
If you sell 100 hats:
Revenue = $1,000
Contribution Margin = $500
This means $500 is available to cover fixed costs and generate profit.
Contribution margin reveals whether your business model actually works.
If CM is negative, you are losing money on every sale. That’s a serious warning sign.
Even if CM is positive, tracking trends helps you understand:
Whether marketing is efficient
Whether product pricing is sustainable
Whether margins are tightening
Where to adjust spending
Unlike revenue or ROAS, contribution margin reflects economic reality.
Marketing costs can quickly erode profitability.
If your acquisition cost exceeds your margin, scaling only increases losses.
For DTC brands, CM helps determine:
Acceptable CAC thresholds
Sustainable channel spend
When to scale or pull back
Brands that prioritize contribution margin naturally make smarter marketing decisions.
Monitoring CM at the product or category level shows which SKUs are profitable and which are dragging margins down.
If margins are declining, you can:
Reduce material or production costs
Negotiate supplier terms
Increase minimum order quantities
Optimize fulfillment
Adjust commissions or fees
CM gives you an early warning before profitability deteriorates.
If a product has a weak contribution margin, you may:
Raise its price
Improve its cost structure
Bundle it with higher-margin products
In some cases, you may reduce price strategically for high-volume SKUs if overall contribution improves through scale.
The goal is not always a higher margin per unit, but a stronger total contribution.
Contribution margin determines whether your business can sustain itself.
Once CM covers fixed expenses like salaries and rent, the remaining amount becomes profit.
If CM is strong, you have room to scale safely. If it’s thin, growth becomes risky.
Retention is often the most efficient growth lever.
Repeat customers:
Cost less to convert
Buy more frequently
Reduce blended acquisition costs
Retention improves CM because revenue increases while variable acquisition costs decline.
Using personalization, email, SMS, and zero-party data strengthens repurchase behavior.
Ways to improve margin include:
Negotiating supplier pricing
Optimizing production
Switching fulfillment providers
Increasing average order value
Introducing bundles
Using free shipping thresholds
If you cannot lower costs, increasing AOV becomes critical.
Raising prices increases revenue per unit, but requires careful execution.
You must evaluate:
Customer price sensitivity
Competitive positioning
Brand strength
Done strategically, price adjustments can significantly improve CM without damaging demand.
As acquisition costs rise and fulfillment expenses increase, brands cannot rely solely on revenue growth.
Contribution margin reveals whether growth is sustainable.
Without it, you risk scaling revenue while shrinking profitability.
Tracking contribution margin manually across channels, SKUs, discounts, and returns is complex.
Clevrr AI, built as an AI co-founder for consumer brands, unifies:
Ad spend
Revenue
Returns
Discounts
SKU-level economics
Fulfillment costs
Instead of just showing revenue, Clevrr AI surfaces:
Contribution margin by campaign
CM by SKU
CM trends over time
Margin leakage risks
This helps founders and finance teams move from reactive reporting to proactive decision-making.
Because in 2026, revenue alone doesn’t define success.
Margin does.
Join hundreds of D2C brands using Clevrr AI to automate their growth and efficiency.
Join 500+ D2C founders using Clevrr AI to automate their operations and scale faster.
Get Started Free