What Is the Difference Between CPO and CPA?
Cost per order (CPO) measures how much your brand spends, on average, to generate any purchase, whether it’s from a new or returning customer.
Cost per acquisition (CPA) measures how much your brand spends, on average, to acquire a new customer who makes a purchase.
The difference is simple but important:
CPO includes all orders. CPA focuses only on new customers.
CPA vs CAC: Are They the Same?
Not exactly. But many brands use them interchangeably.
Cost per acquisition (CPA) usually refers specifically to marketing spend, most often paid media, required to acquire a new customer.
Customer acquisition cost (CAC) is broader. It includes not only marketing spend, but also related expenses such as:
In practice, many brands blur the distinction. However, technically speaking, CAC represents the fully loaded cost of acquiring a customer, while CPA often reflects just advertising spend.
When Should You Use CPO vs CPA?
The answer depends on your growth stage.
Early-Stage Brands
If your business is new and focused on rapid growth, most orders will come from new customers. In that case, CPO and CPA will look very similar.
At this stage, tracking cost per order may be sufficient.
Growing Brands
As your customer base expands, repeat purchases increase. That’s when tracking CPA separately becomes important.
This helps you understand:
How much do you spend to acquire customers
How much do you spend on repeat orders
Whether retention is reducing your blended costs
Neither metric is “more important.” The right metric depends on where your brand is in its growth journey.
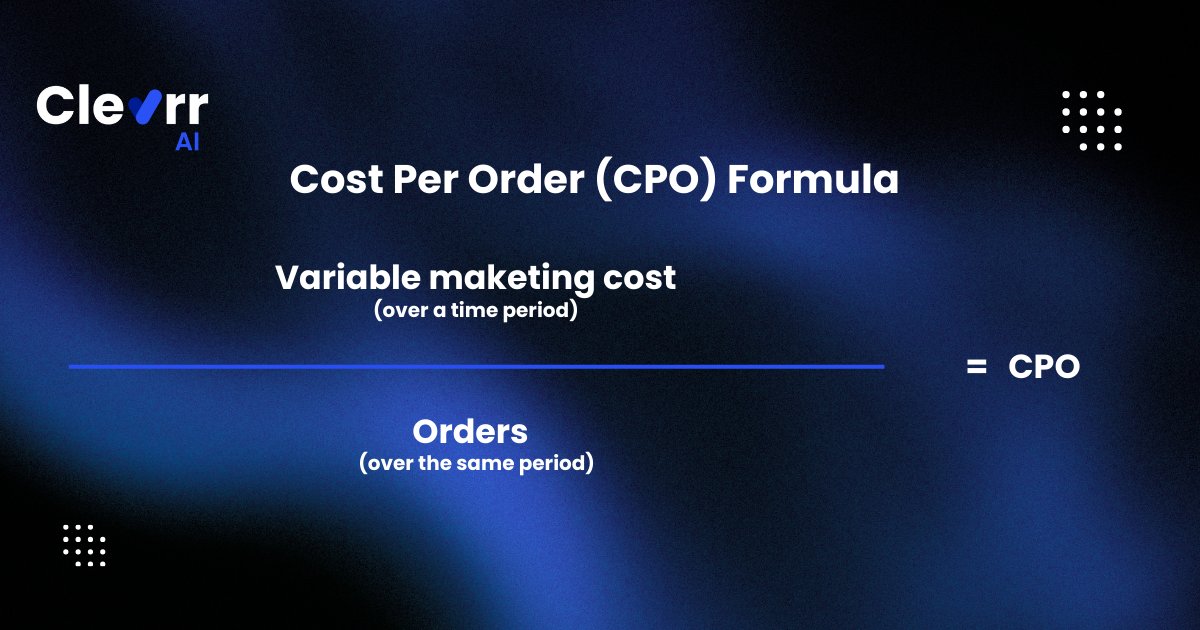
The formula for cost per order is:
Marketing Cost ÷ Total Orders (during the same period)
You can calculate CPO:
Segmenting CPO often reveals where you should increase or reduce spend to maximize efficiency.
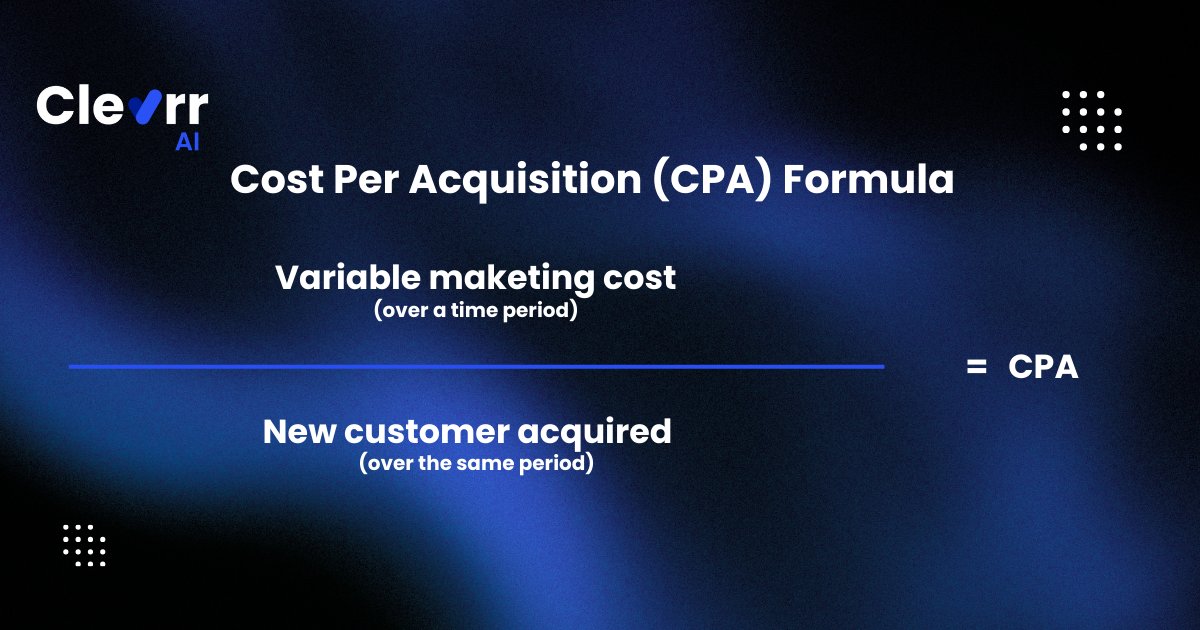
The formula for cost per acquisition is:
Marketing Cost ÷ New Customers Acquired (during the same period)
Like CPO, CPA can be calculated:
Across all channels
By channel
By campaign
It’s common for different channels to produce new customers at very different costs.
As a general rule, acquiring a new customer is always more expensive than driving a repeat purchase. When testing new audiences or acquisition strategies, performance can vary significantly, so it’s wise to review results regularly.
What Is ROAS?
ROAS stands for Return on Ad Spend.
It measures how much revenue is generated for every dollar spent on advertising.
ROAS helps identify which campaigns or channels are generating the most revenue relative to spend.
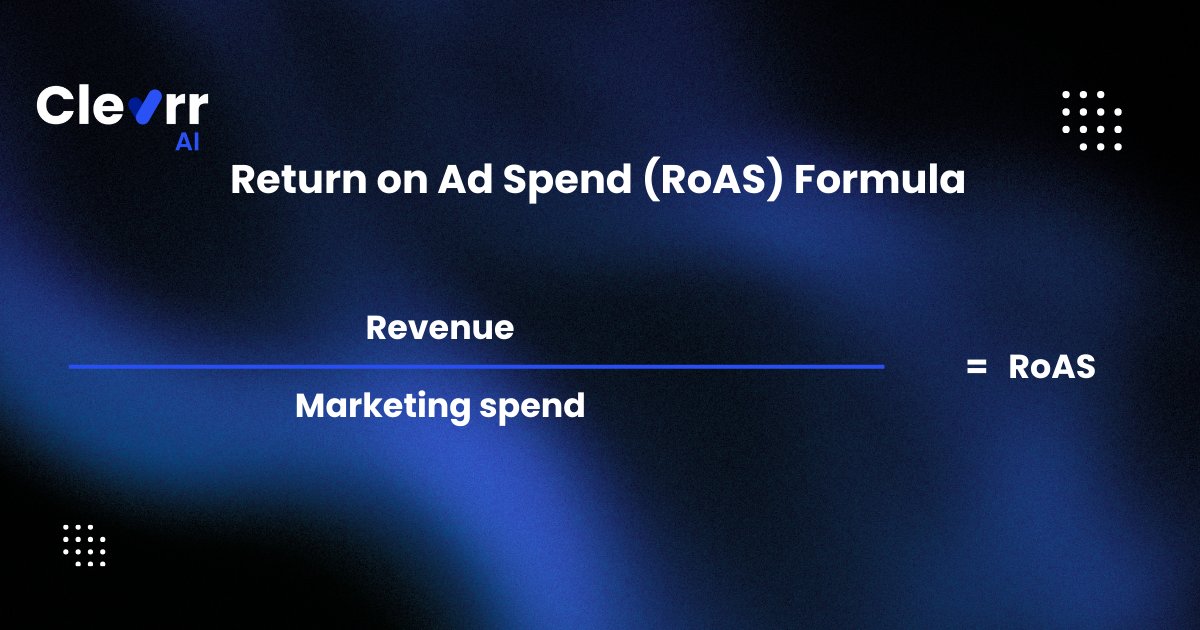
The formula for ROAS is:
Revenue ÷ Marketing Spend
ROAS can be represented in several ways:
All representations reflect the same concept: revenue efficiency.
When to Use ROAS vs CPO
ROAS becomes especially important when you sell products with widely varying price points.
If your catalog includes items priced at $5 and others at $200, a single CPO target can be misleading.
For example:
If your CPO target is $30, and you spend $30 to generate a $10 order, you lose money. But CPO alone doesn’t reflect that clearly.
ROAS directly ties revenue to spend, making it more appropriate when price variability is high.
An alternative approach is to set different CPO targets by category. For example:
Segmented targets provide more accuracy than a single blended number.
How to Set CPO or CPA Goals
Your targets should align with your financial strategy. Ask yourself:
What is your average customer lifetime value (LTV)?
Are you willing to invest upfront for long-term profitability?
Do margins vary significantly by product or category?
Are your campaigns focused on awareness or conversion?
If your goal is aggressive growth, you may tolerate:
Higher CPA
Higher CPO
Lower ROAS
If your goal shifts toward profitability, you will aim to:
What Is a “Good” Cost Per Order?
There is no universal benchmark.
For new brands, CPO is usually higher because awareness is low and acquisition costs are higher.
Established brands often have lower CPO because repeat purchases occur through lower-cost channels, such as:
Direct traffic
Branded search
Email marketing
As a general guideline:
Ultimately, “good” depends on your margins, growth strategy, and capital position.
The Best Way to Use CPO, CPA, and ROAS
These metrics should not compete with each other. They should work together.
Align marketing and finance teams around:
Segmenting by:
Channel
Product category
Customer type
…creates more flexibility and precision.
The key is clarity and consistent methodology across teams.
There’s no single “correct” metric. The right combination depends on your objectives.
Bringing It All Together
If you find yourself constantly toggling between spreadsheets trying to reconcile CPO, CPA, ROAS, and CAC, the problem isn’t the formulas. It’s the lack of unified visibility.
Instead of manually calculating and debating these metrics, platforms like Clevrr AI bring marketing, sales, and financial data together in one intelligence layer.
Rather than just showing CPO or ROAS in isolation, Clevrr AI connects:
Ad spend
Revenue
Contribution margin
SKU-level economics
Customer cohorts
…so teams can understand not just efficiency, but profitability.
Because in 2026, tracking metrics isn’t enough.
You need to know which ones actually protect margin and scale responsibly.