Business34 min read
Root Cause Analysis: Spot Revenue Leakage
Understand exactly what caused the drop, how much impact it had, and what to fix first.
Understand exactly what caused the drop, how much impact it had, and what to fix first.

Root Cause Analysis (RCA) is a structured way of understanding why a change happened in your business. Instead of looking at surface-level metrics, it focuses on identifying the underlying factors that contributed to an outcome and quantifying their impact.
In ecommerce, revenue is not driven by a single variable. It is the result of multiple interconnected factors such as demand, pricing, conversion, and operations. RCA breaks down these components and shows how each one contributes to the outcome. This makes it possible to move beyond observation and toward explanation.
Rather than asking what changed, RCA answers a more important question. What caused the change, and by how much?
Related read: Revenue Growth
Most ecommerce teams already have access to data. The challenge is not visibility, but clarity. When revenue drops, teams often rely on dashboards across multiple tools to investigate what went wrong. Marketing looks at ad performance, finance reviews margins, and operations checks fulfillment. Each function sees part of the picture, but no one sees the complete story.
This leads to a fragmented understanding of the business. Metrics are available, but they are not connected. Teams spend time comparing numbers, forming assumptions, and trying to identify patterns manually. Even after detailed analysis, the root cause often remains unclear.
RCA is necessary because it connects these disconnected signals. It brings together multiple factors into a single structured explanation and quantifies their impact. This reduces dependency on manual analysis and enables faster, more confident decision-making. Instead of spending hours investigating, teams can quickly understand what changed and why it matters.
Clevrr AI brings Root Cause Analysis into a single canvas where you can break down revenue changes, understand their drivers, and move toward action. The process starts with net sales and gradually expands into deeper layers of analysis, allowing you to understand not just what changed, but why it changed.
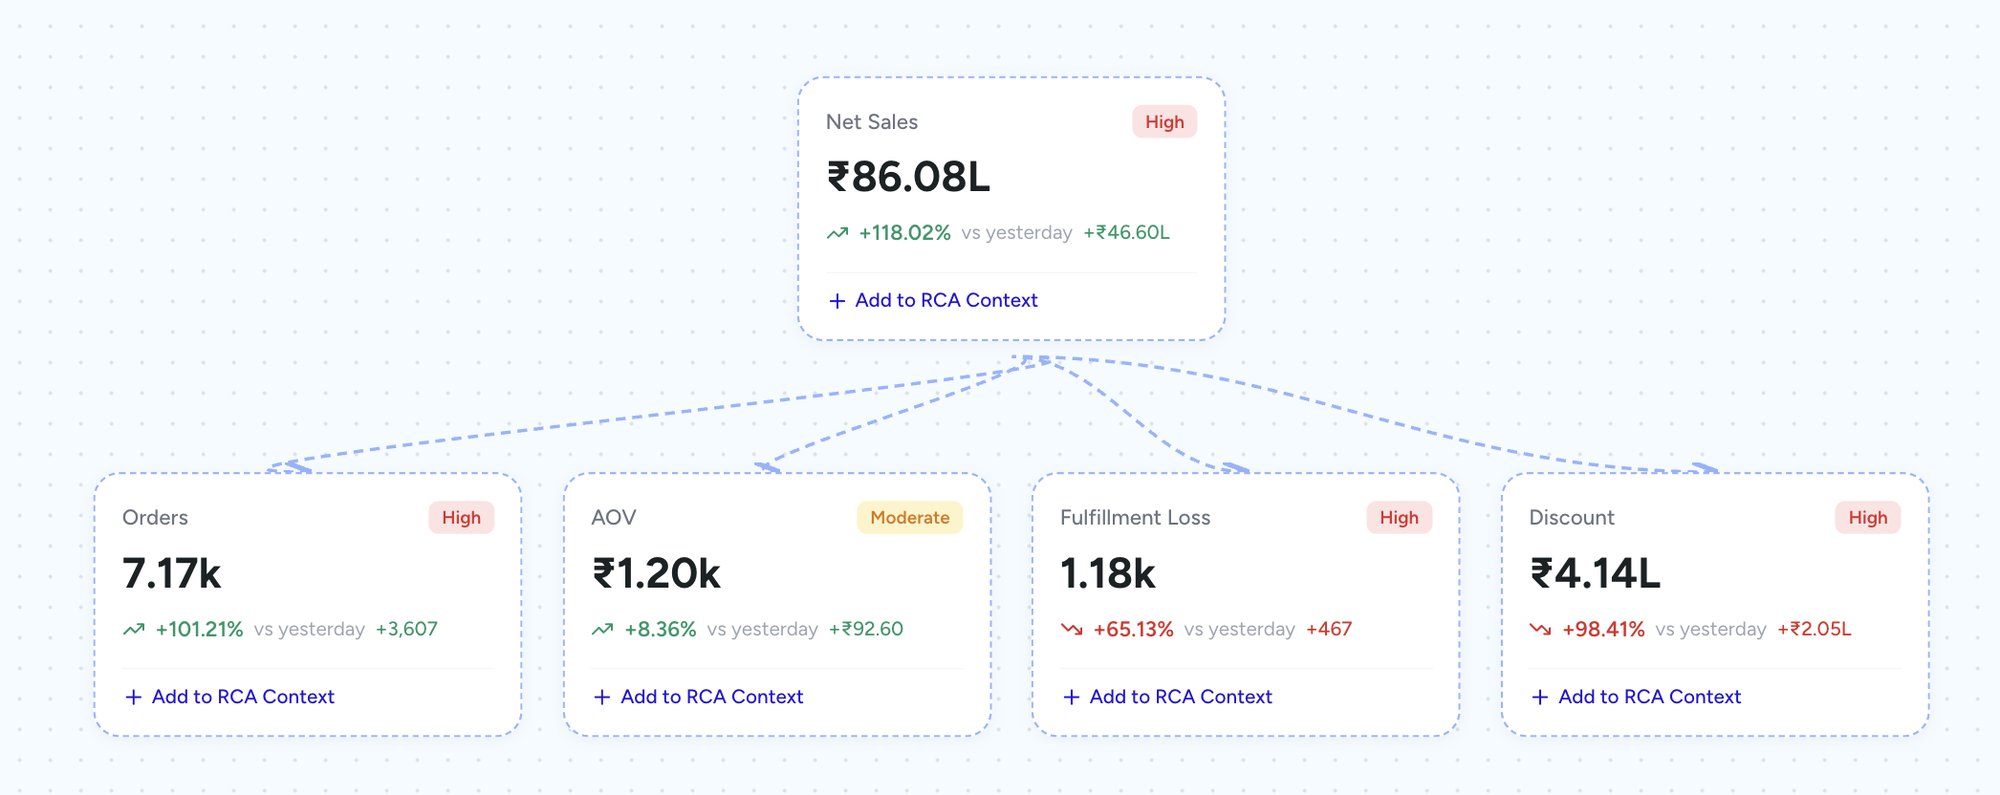
At the core of this analysis are the main drivers of any dip or spike in net revenue. These include demand loss, value loss, operational loss, and wasted ad spend. Each of these components represents a different dimension of your business, and together they provide a complete view of what is impacting revenue.
See what’s impacting your revenue → Analyze today
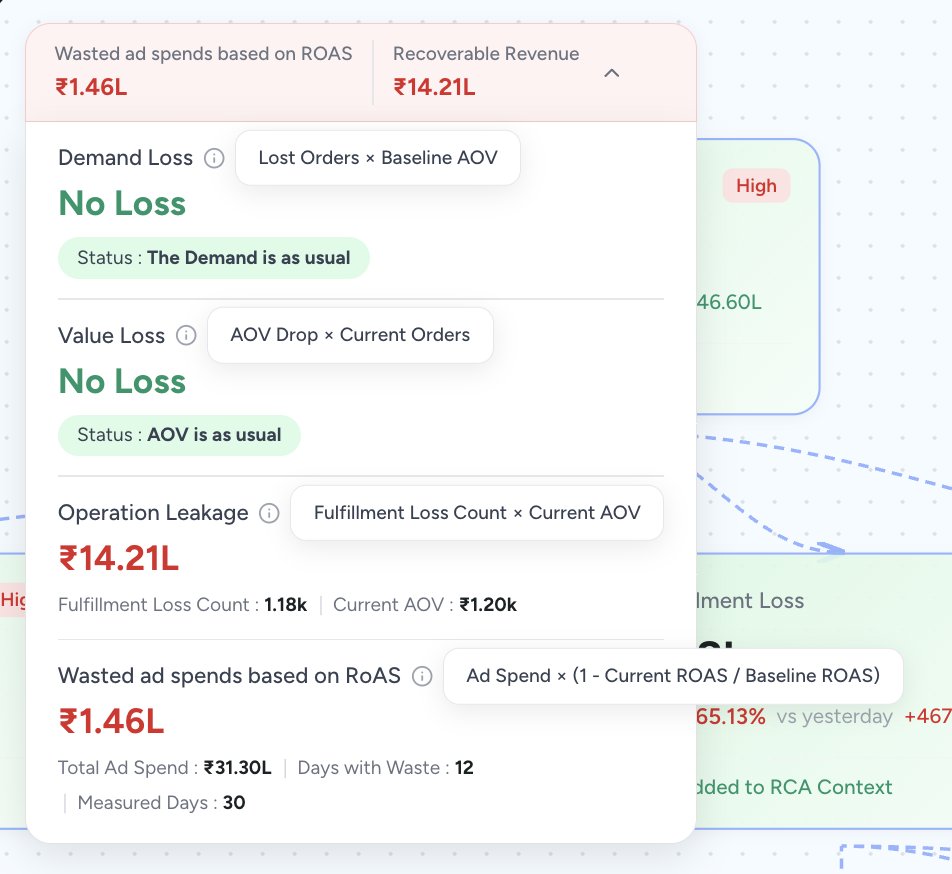
Demand loss reflects a reduction in the number of orders. It helps you understand whether the drop in revenue is driven by fewer customers purchasing.

Clevrr calculates this by comparing the drop in orders against your baseline average order value. This gives a clear estimate of how much revenue was lost purely due to a decline in demand. It is often the first signal of issues in traffic, acquisition, or conversion.
Value loss focuses on how much customers are spending. Even if order volume remains stable, a decline in average order value can significantly impact revenue.

This is calculated by measuring the difference in AOV and applying it to the current number of orders. It highlights whether revenue loss is coming from pricing changes, discounting strategies, or shifts in customer purchase behavior.
Operational loss captures revenue that is lost due to fulfillment issues. This includes failed deliveries, cancellations, or inefficiencies in operations that prevent orders from being completed successfully.
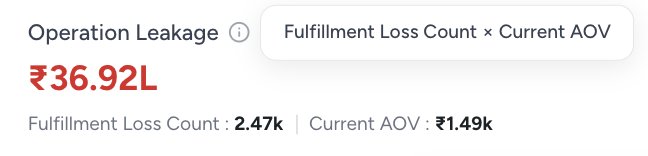
By multiplying the number of affected orders by the current AOV, Clevrr quantifies the revenue impact of operational gaps. This helps teams identify issues beyond marketing and demand, bringing operations into the analysis.
Clevrr also evaluates the efficiency of your marketing spend. When your current ROAS drops below your baseline, part of your ad spend stops generating expected returns.
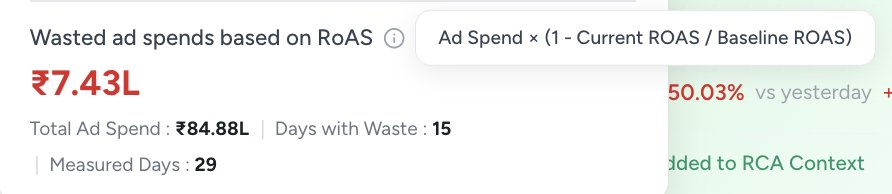
Wasted ad spend is calculated by comparing current performance against the baseline ROAS. This shows how much of your budget is underperforming and helps teams make more informed decisions about scaling or optimizing campaigns.
Once you’ve identified the key drivers behind the change, the next step is to add them to the RCA agent as context. This allows the system to understand the full picture of what is happening, rather than looking at individual metrics in isolation.
By feeding these components into the RCA agent, you enable it to generate a more detailed and accurate summary. It not only explains the main reasons behind the dip or spike but also suggests what needs to be done next.
Once you start exploring these components, you can add them to the RCA agent to build context. This step is important because revenue changes are rarely driven by a single factor.
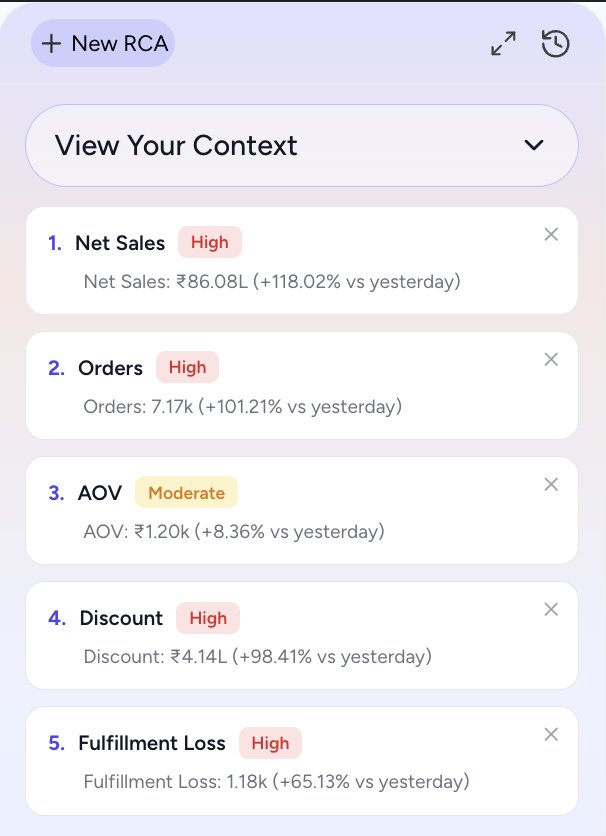
By selecting and combining different components, you create a more complete picture of what is happening in the business. The system uses this context to understand relationships between different variables and prepare for deeper analysis.
After building sufficient context, you can generate a summary using the RCA agent. This produces a structured explanation that outlines what changed, why it changed, and which factors contributed the most.
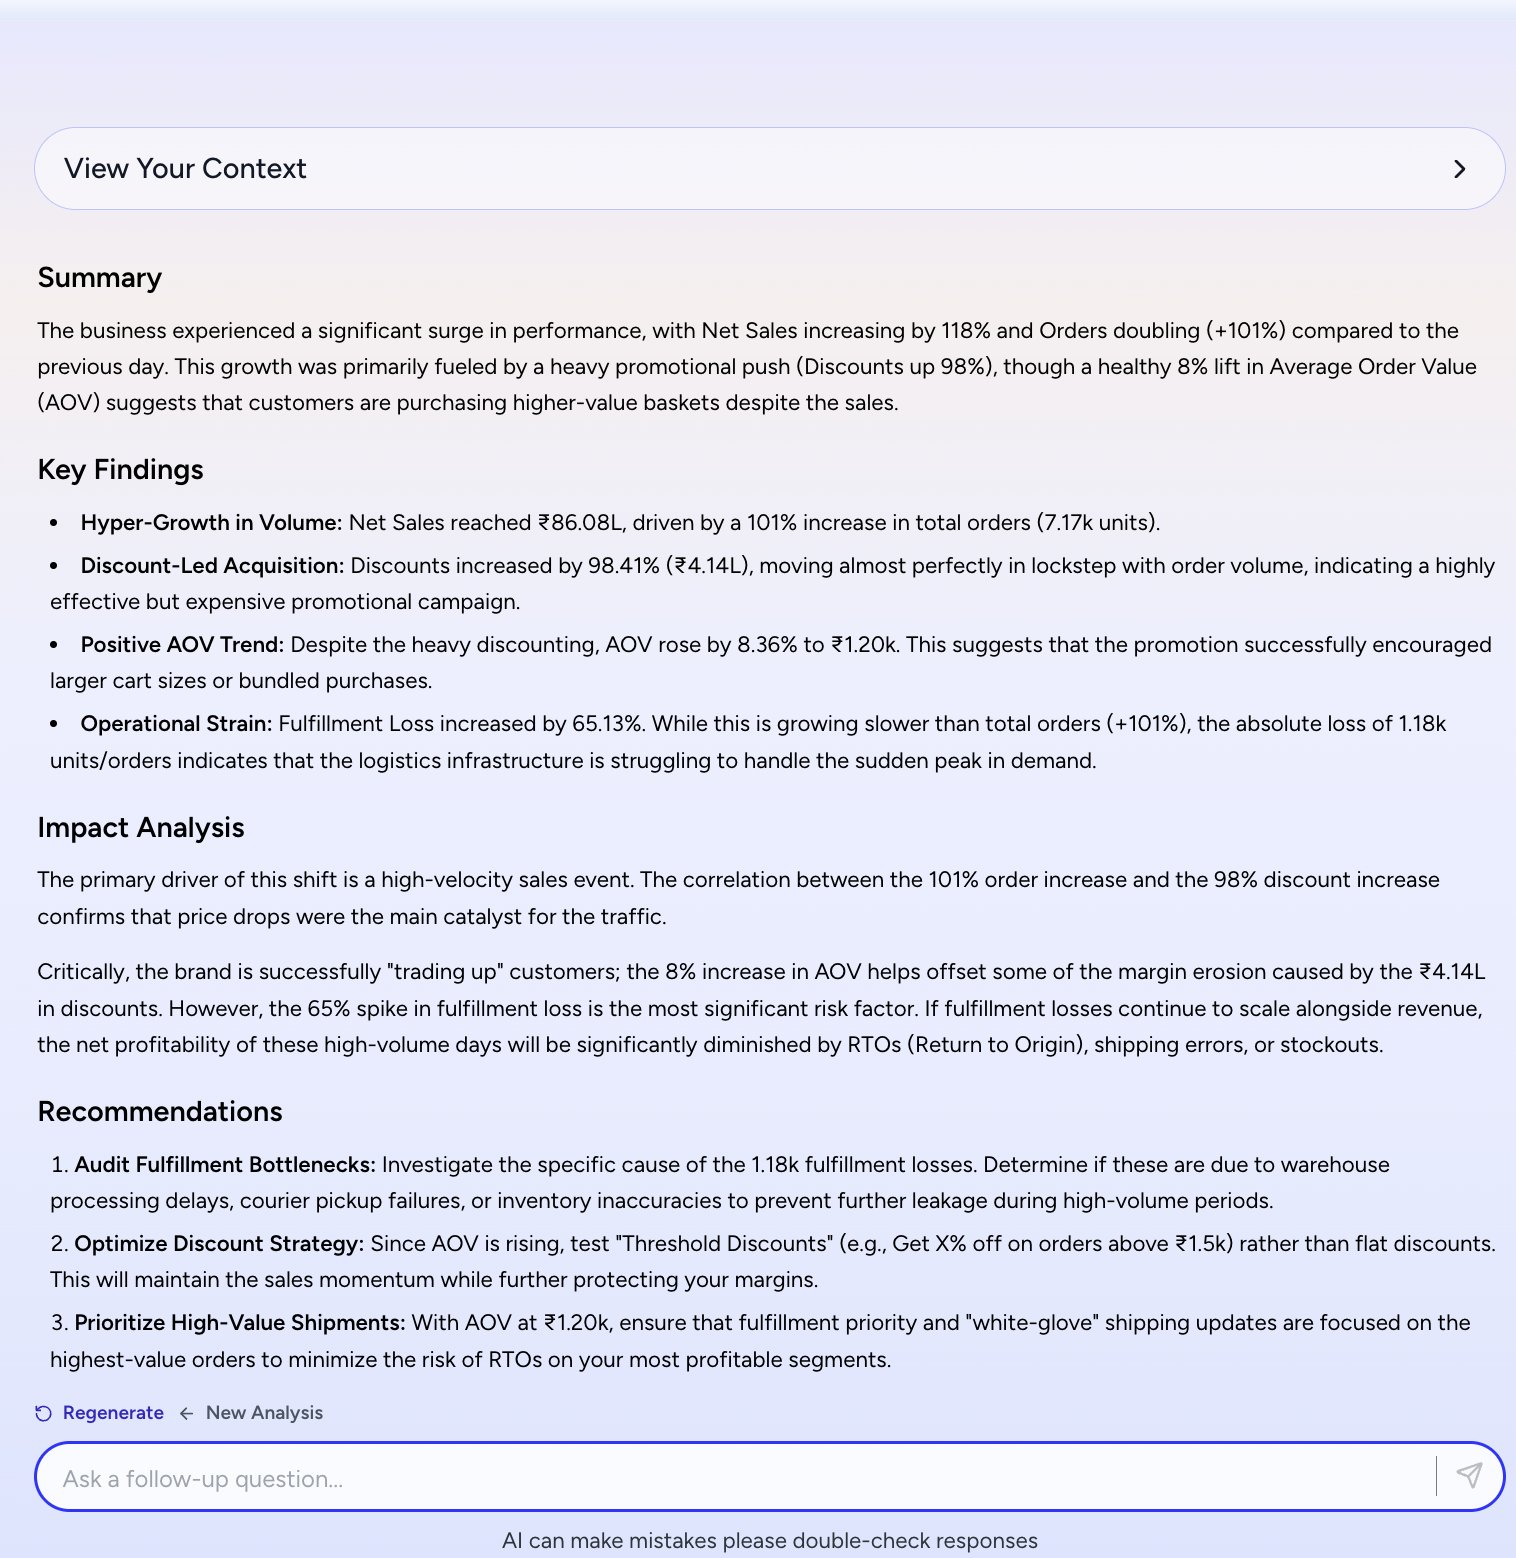
The summary is not static. You can ask follow-up questions, explore specific drivers further, and refine your understanding. This makes the analysis interactive and allows teams to move from raw data to clear, actionable insights in a much shorter time.
Understanding why revenue changes is one of the most important challenges in ecommerce. While most tools provide visibility into metrics, very few offer clear explanations. This gap often results in delayed decisions and missed opportunities.
Root Cause Analysis addresses this by turning fragmented data into a structured explanation. It enables teams to move from observation to understanding and from understanding to action.
Clevrr AI is built around this principle. By combining data, context, and AI-driven explanations, it provides a clear and actionable view of what is happening in the business.
Start your first RCA today → Explore RCA Tool
If answering “why did revenue drop?” still takes hours, the problem is not the lack of data. It is the absence of a system designed to explain it.
Join hundreds of D2C brands using Clevrr AI to automate their growth and efficiency.
Join 500+ D2C founders using Clevrr AI to automate their operations and scale faster.
Get Started Free