Design13 min read

Part 1: How a simple client question led us from dashboards to whiteboards and the foundation of RCA.
Part 2: How we transformed that business logic into flows, wireframes, and the final RCA experience.
When we started building Clevrr AI, our goal was simple: help D2C brands make faster and better decisions using their business data.
Naturally, we built dashboards — lots of them. We developed sales dashboards, marketing dashboards, product analytics, campaign tracking, and operational metrics. Packed with filters, comparisons, trend analyses, and performance breakdowns, we genuinely believed we had covered almost every important business metric a brand could ever need.
The product looked complete. Then, one conversation changed everything.
A client came to us with a straightforward but critical problem:
At first, we thought finding the answer would be easy. We built the product ourselves, understood the data structure, and intimately knew the ecosystems of Shopify, Meta Ads, Google Analytics, fulfillment metrics, attribution systems, and campaign performance. We assumed we could find the answer in a flash.
But reality hit differently.
We opened Clevrr and began jumping from the sales dashboard to marketing, then to product, customer, and fulfillment metrics. We started manually cross-referencing and comparing a massive web of variables:
● ROAS
● Conversion rates
● Average Order Value (AOV)
● Discount trends
● Product performance
● Delivery issues
● Returning customer behavior
● Spend allocation
Even with all this data readily available, locating the actual root cause behind the sales drop was painfully difficult.
We eventually found the answer, but it left us with an uncomfortable truth: The time it took us to find the root cause inside our own advanced analytics product was almost equal to the time the client’s team spent manually switching between spreadsheets, Meta, Google Analytics, and Shopify.
That single moment completely transformed how we thought about analytics. We realized a fundamental truth: Businesses don’t struggle with seeing numbers; they struggle with understanding cause and action. Surprisingly, most analytics tools are terrible at answering the “why”.
That painful realization became the starting point for building our Root Cause Analysis (RCA) framework.
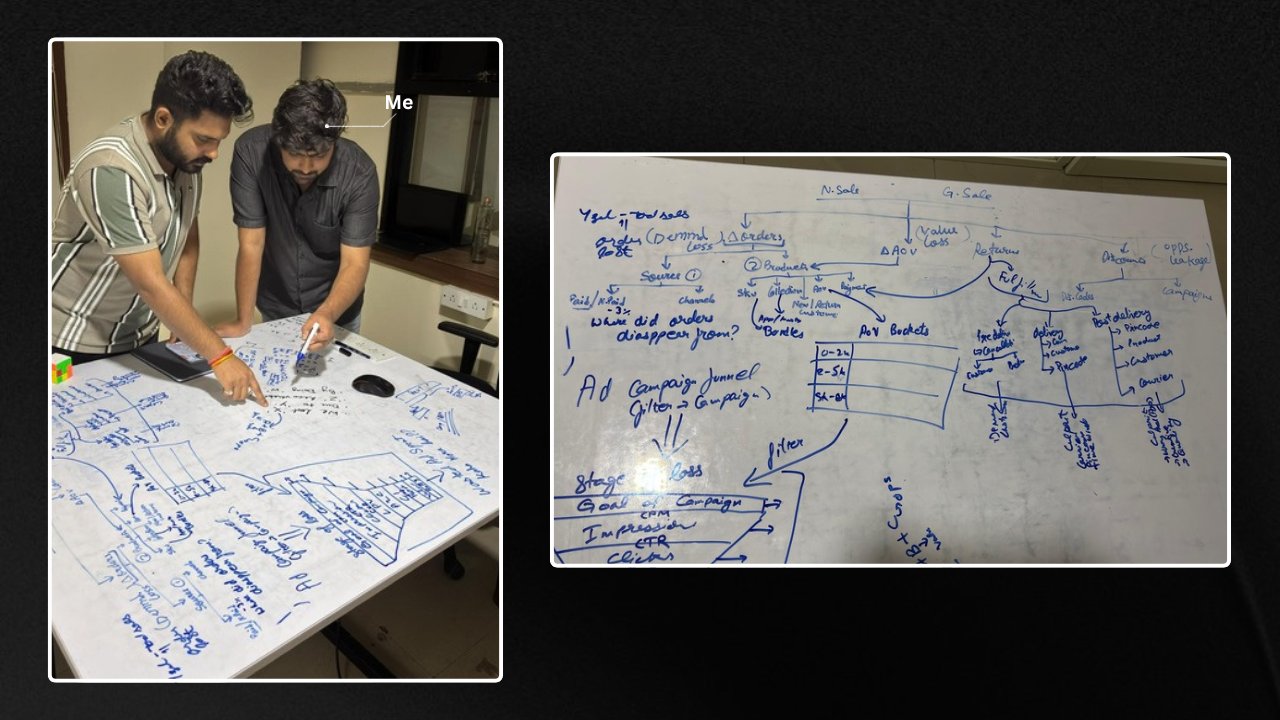
The next few days looked completely different for our team. We completely stopped designing UI screens. Instead, we gathered around a whiteboard to manually map out how revenue actually moves inside a D2C business so we could systematically answer our client’s question.
Initially, we identified four major business drivers:
● Orders
● AOV
● Fulfillment
● Discounts
But once we started digging deeper, we realized that every single factor opened up an entirely new layer of questions.
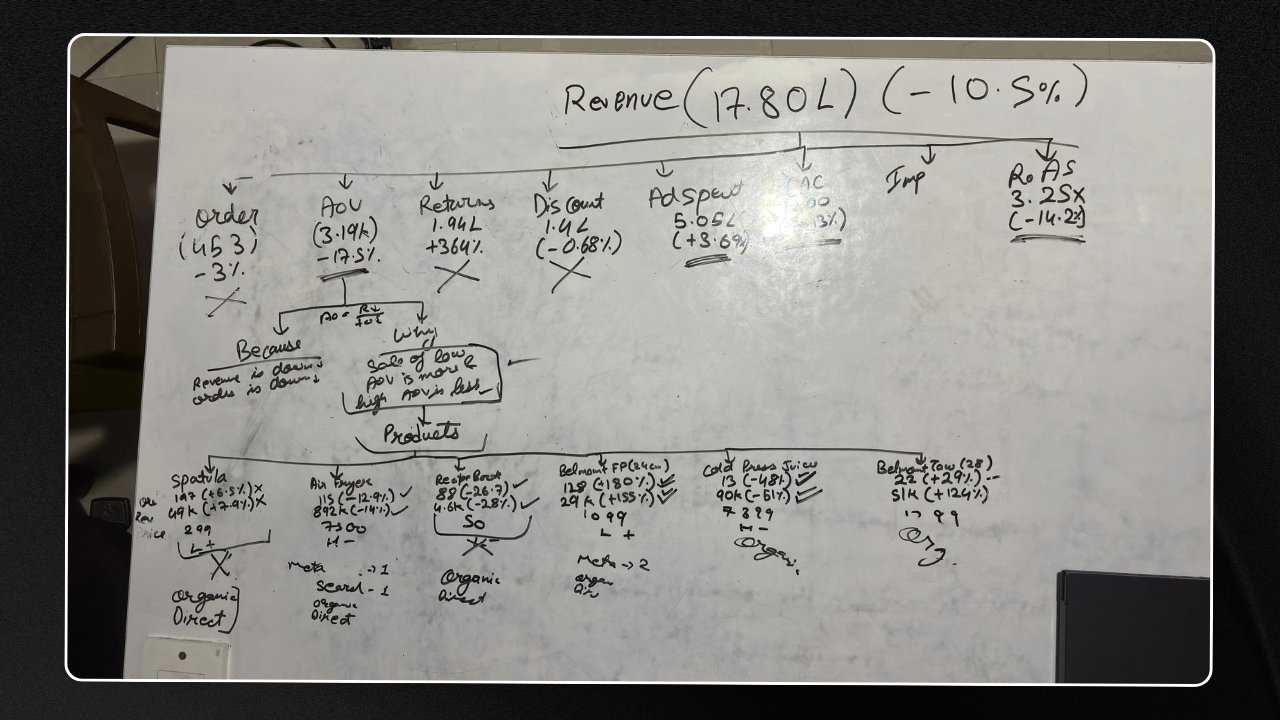
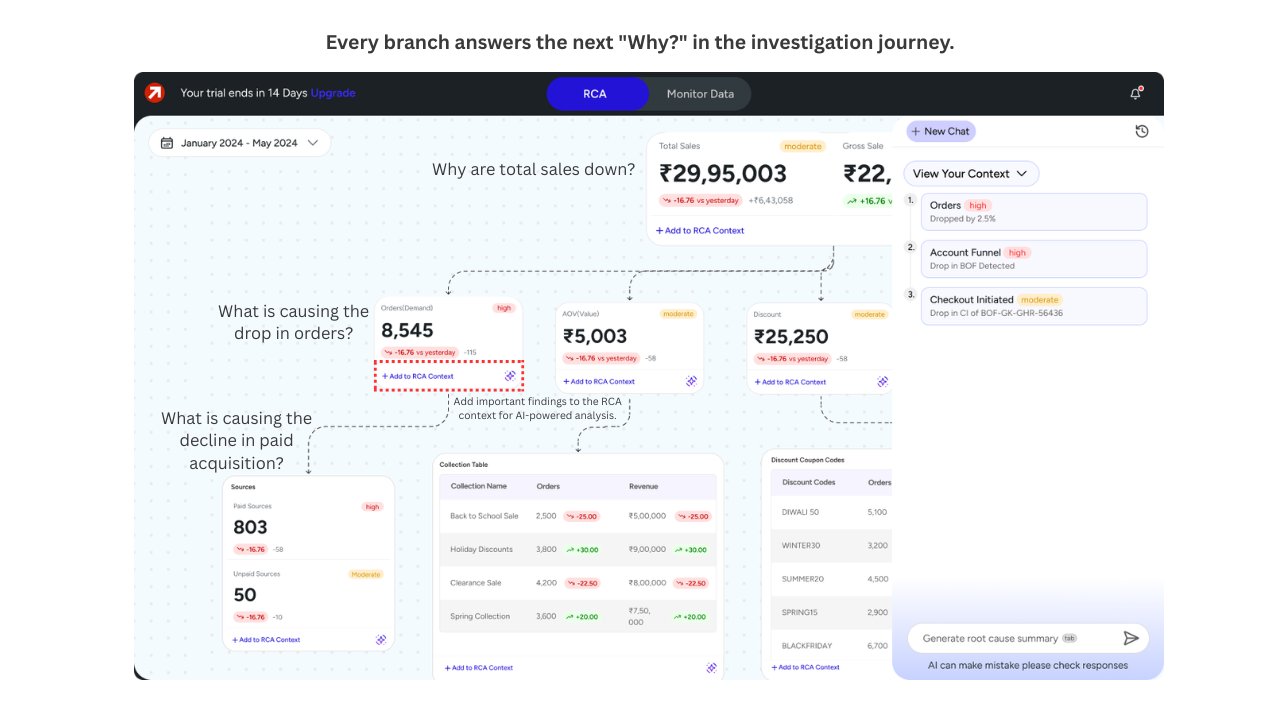
For example, if Orders are down, you have to ask why? That question immediately forces you down several deep branches:
● Lower traffic on the website
● Poor conversion rates
● Weak ad creatives
● Inaccurate targeting
● Checkout friction
● Underperforming Meta campaigns
If you follow the Meta campaign performance branch down further, the next question becomes: “Why is Meta performance dropping?” Once again, more sub-branches appear:
● Top of Funnel (TOF) campaigns are failing
● Creative fatigue is setting in
● Wrong audience targeting
This process kept repeating. Every single answer generated another “why,” and every metric revealed a hidden layer underneath it. Very quickly, our whiteboard stopped looking like a clean dashboard flow and started looking like a massive decision tree.
That’s when the real insight clicked: Root cause analysis is entirely non-linear.
Uncovering the Hidden Layers of Causation
Business metrics don’t live in isolation; they behave like a highly connected chain of business events. The deeper we investigated, the more we noticed a fascinating pattern: no matter where an investigation started — whether with Orders, AOV, Fulfillment, or Discounts — almost all paths eventually connected back to customer acquisition behavior, operational inefficiencies, or campaign quality.
Behind a simple drop in sales, the real culprit was often a complex, multi-layered issue, such as:
● Marketing Missteps: Scaling weak campaigns or suffering from creative fatigue.
● Operational Friction: Inventory mismatches with active ads or delayed deliveries are hurting repeat purchase rates.
● Financial Erosion: Aggressive discounting reduces overall profitability or low-quality traffic, inflating ad spend.
Between the final sales drop and the actual root issue at the campaign or operational level, there were often 4 to 5 layers of contributing factors. This hidden complexity was exactly what businesses were struggling to untangle every day.
That was the exact moment RCA stopped feeling like just another software feature; it became something much bigger.
We completely stopped thinking about building:
● More charts
● More dashboards
● More filters
● More reports
Instead, I collaborated with the Engineering team around a single question: How can we build a system that thinks through business problems the exact same way an experienced human operator would?
We shifted from simply displaying data to actively connecting events, explaining causation, and drastically reducing investigation time. Our goal was to help teams seamlessly transition from asking “What happened?” to instantly knowing “Here’s why it happened.”
This shift completely redefined the trajectory of Clevrr AI. Because at the end of the day, the future of analytics isn’t more dashboards. it’s intelligent systems that empower businesses to truly understand their decisions.
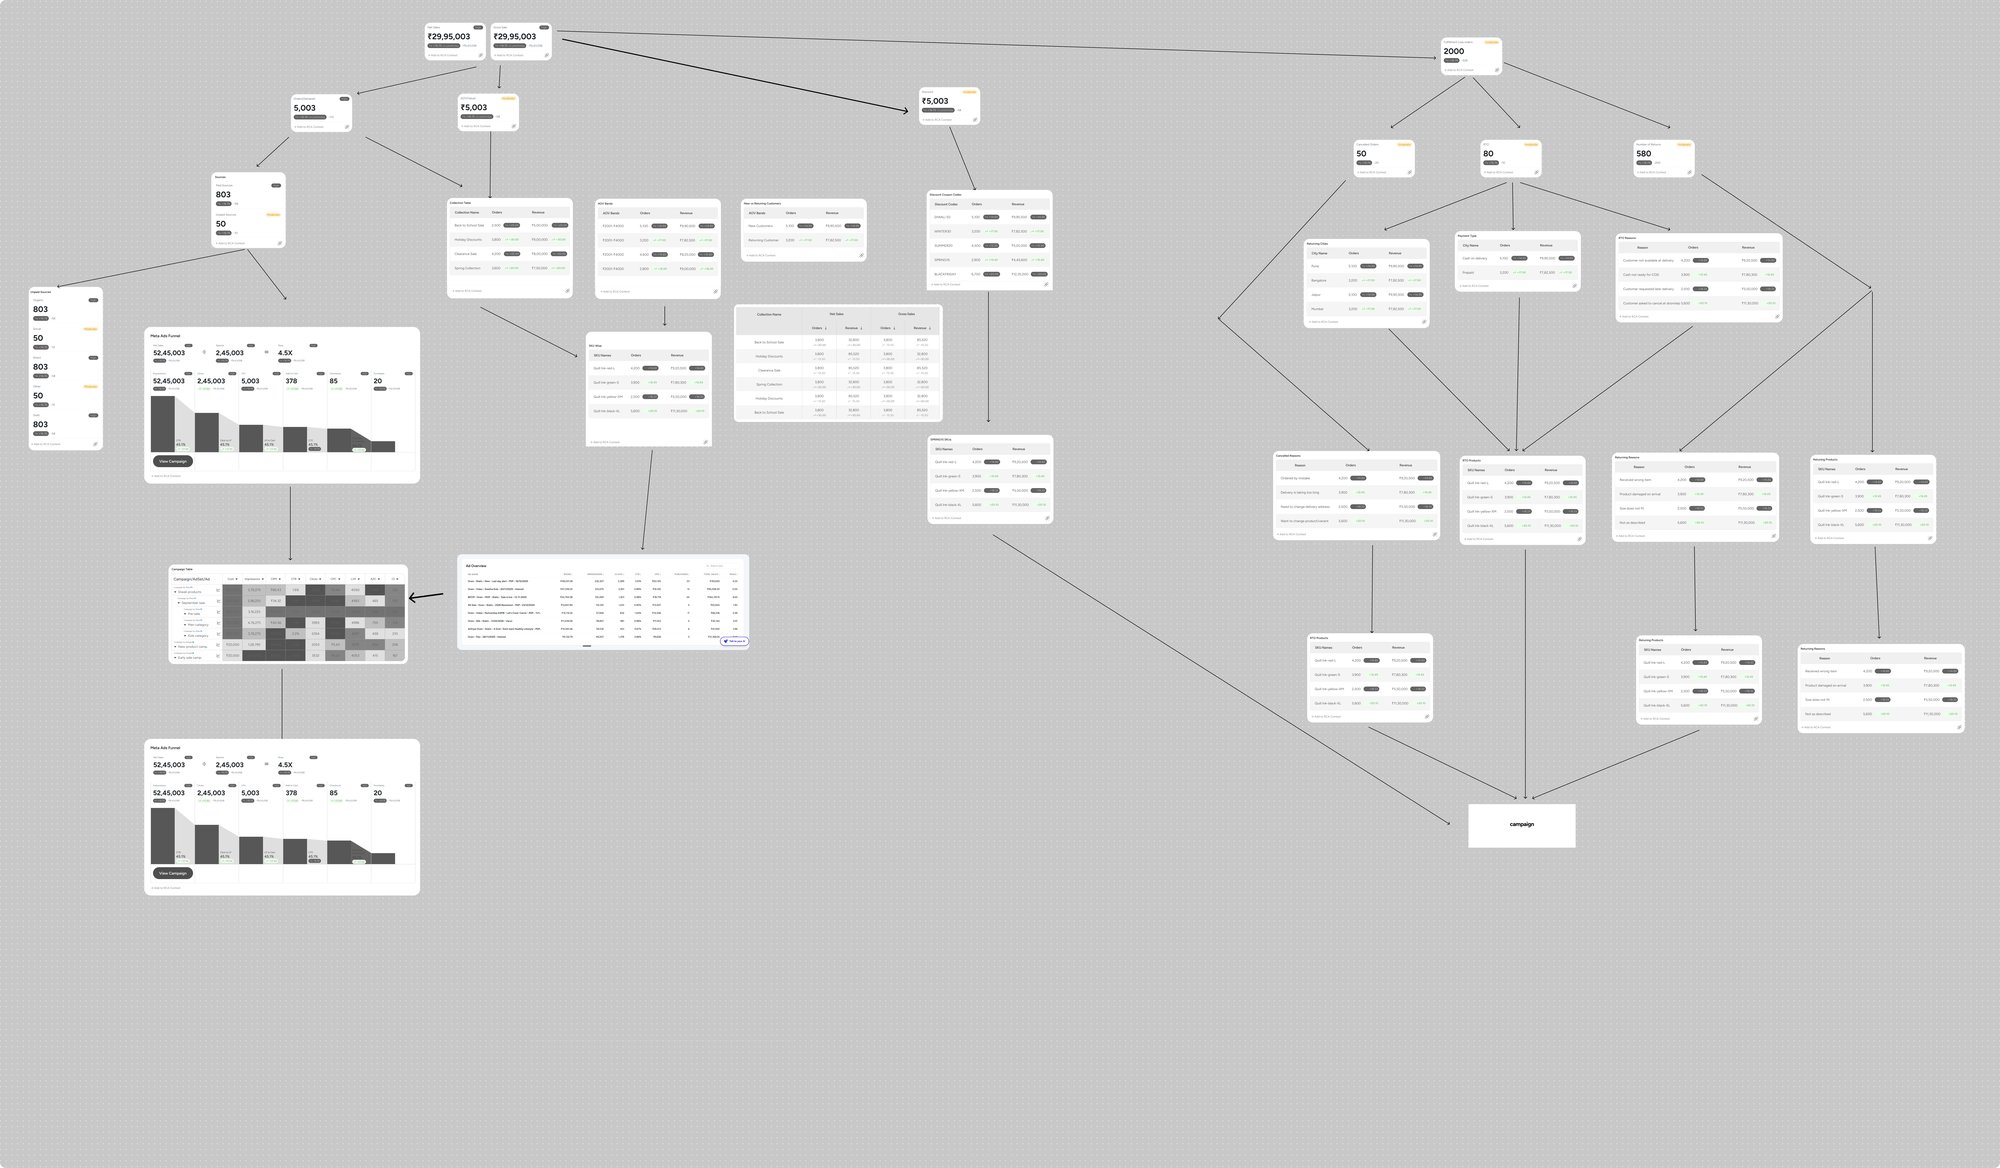
After weeks of mapping revenue drivers and complex business relationships, we had built something massive — it looked like a giant, sprawling decision tree. While the underlying business logic was rock solid, it brought us face-to-face with a looming challenge:
How do we turn a complex backend decision tree into a product that human beings can actually use?
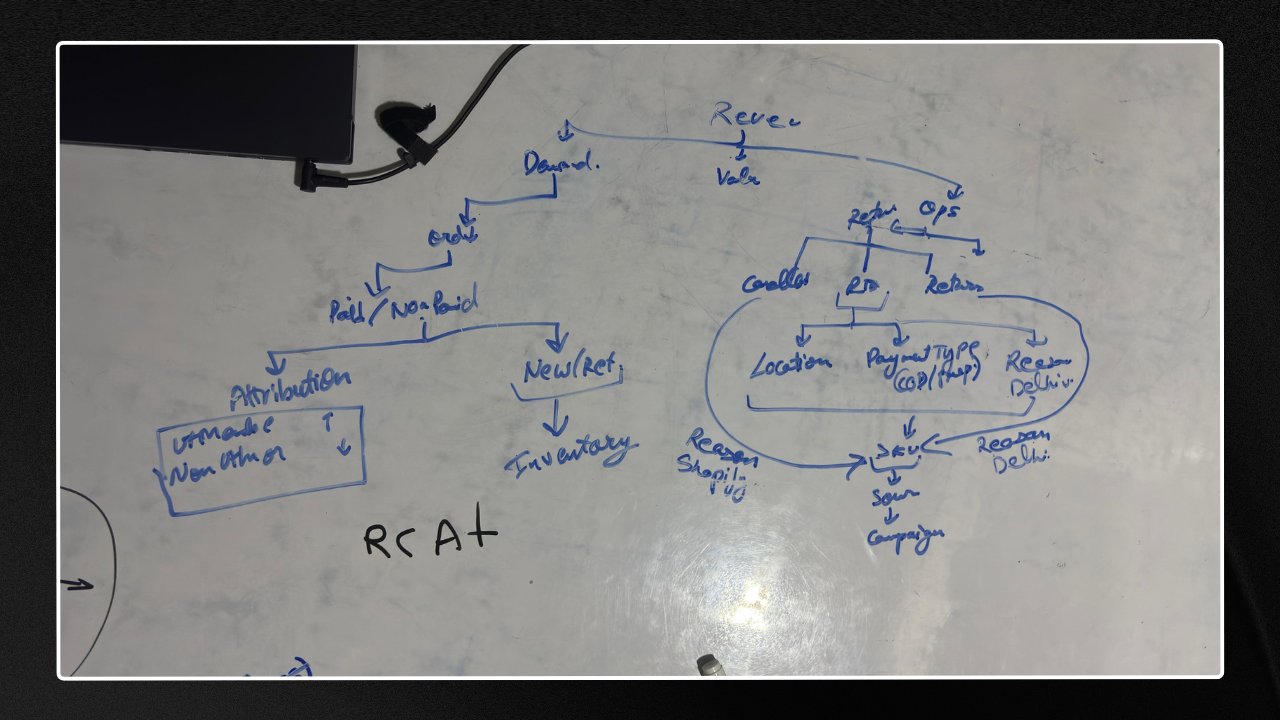
Before we even dreamed of opening Figma, we lived on whiteboards. We drew relentlessly, mapping out:
● Revenue trees
● Cause-and-effect branches
● Investigation paths
● User journeys
The goal wasn’t to design pretty screens. The goal was to deeply understand the psychology of an operator — how a real user thinks and moves when they are frantically trying to uncover the reason behind a sudden sales dip.
3. Sketching Different User Flows
Once the business logic crystallized, we transitioned to notebooks for rough, rapid-fire sketching. We forced ourselves to answer tough, structural questions:
● Where exactly should a user start their investigation?
● How many levels deep should we allow them to go?
● How do users seamlessly transition between different root causes?
● What happens when multiple distinct factors contribute to the same problem?
● How do we prevent users from getting utterly lost in a sea of data?
At this stage, speed mattered infinitely more than visual aesthetics. We weren’t designing pixels yet; we were entirely focused on the flow.
Only after the foundational flows were completely locked in did we begin listing actual features. We approached feature definition by asking operational questions:
● Should users be able to zoom in and out of a massive canvas freely?
● How should interactive drill-downs work mechanically?
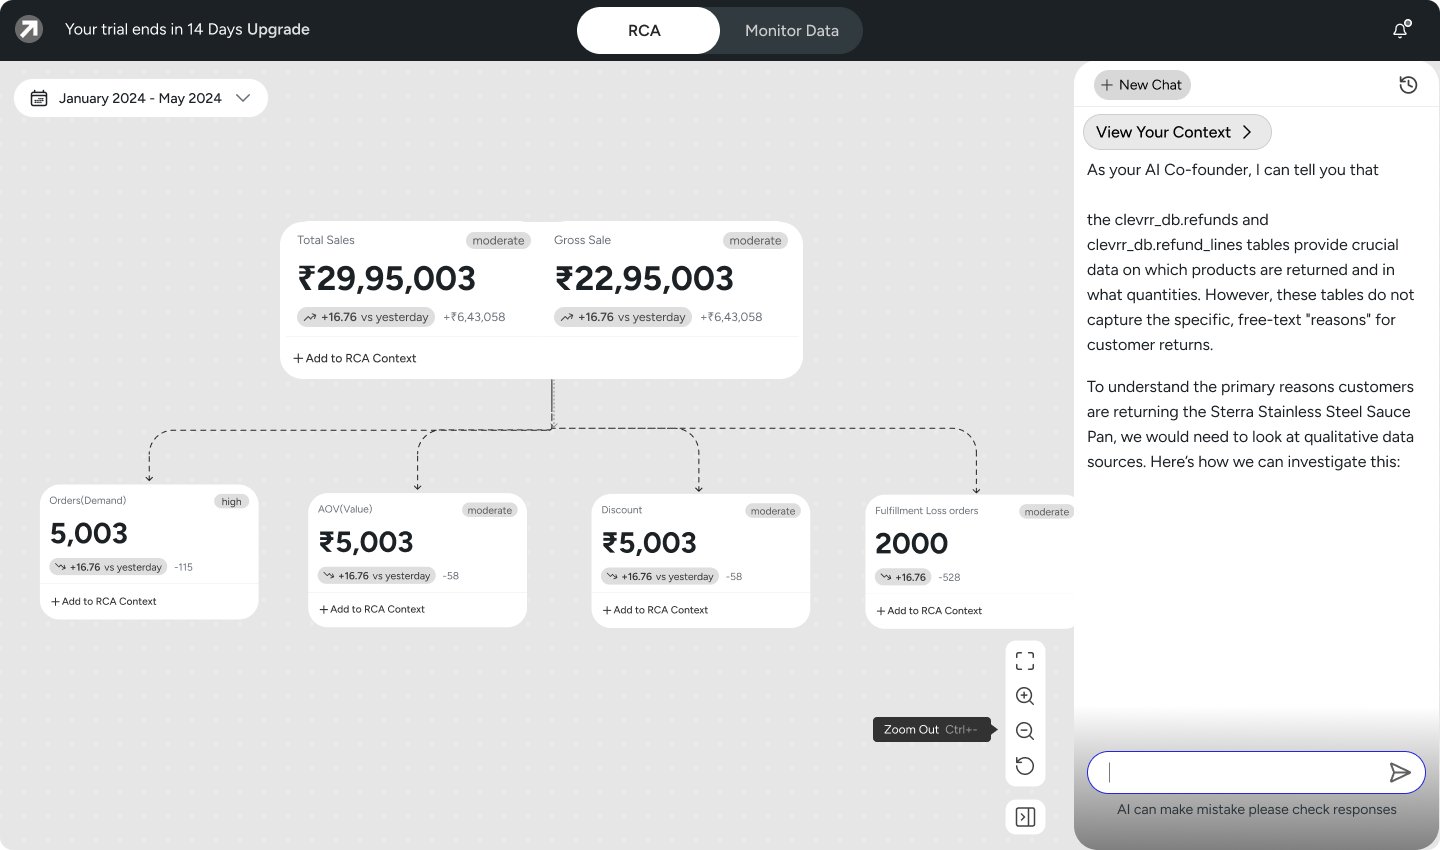
● Should there be an automated AI summary to synthesize the findings?
● How do users compare different metrics side-by-side?
● How do teams navigate large, complex RCA trees without losing their minds?
● How do they backtrack to a previous node without losing their current context?
At this stage, we were still strictly designing behavior, not visuals.
● Navigation paths
● Visual hierarchy
● Core interactions
● Information architecture
This low-fidelity validation helped us catch and kill critical UX issues long before we spent time on visual design.
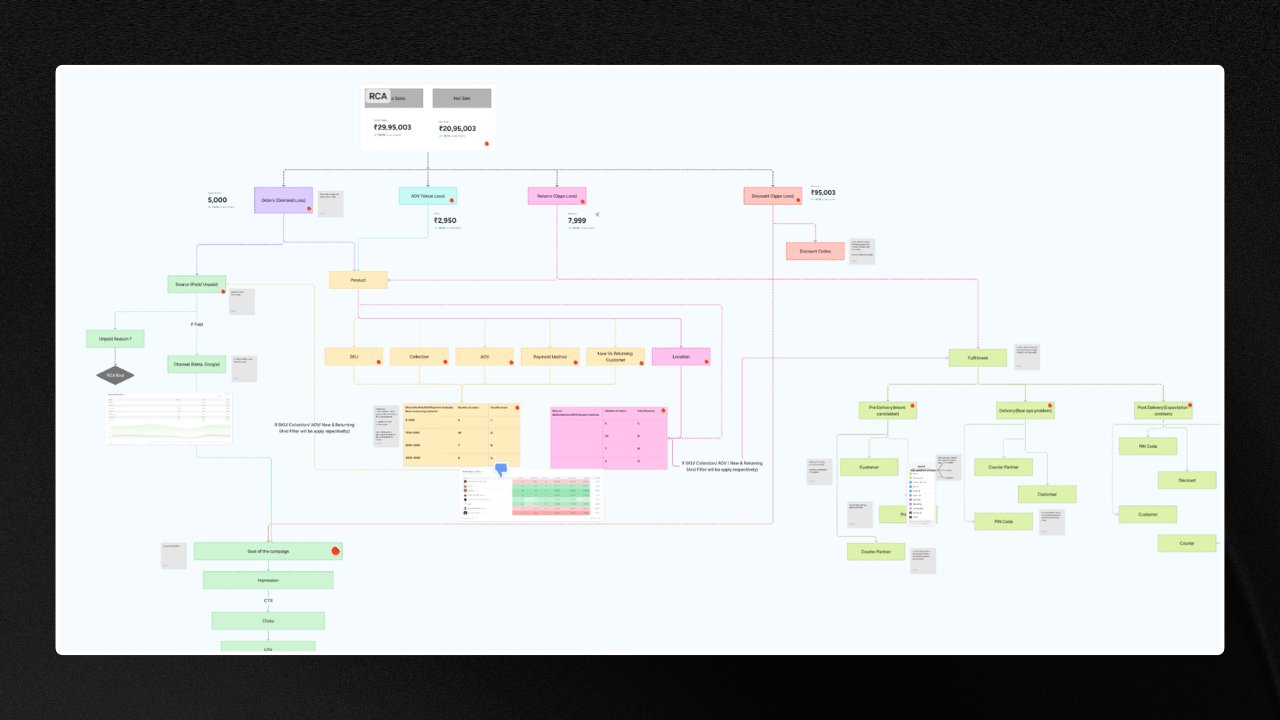
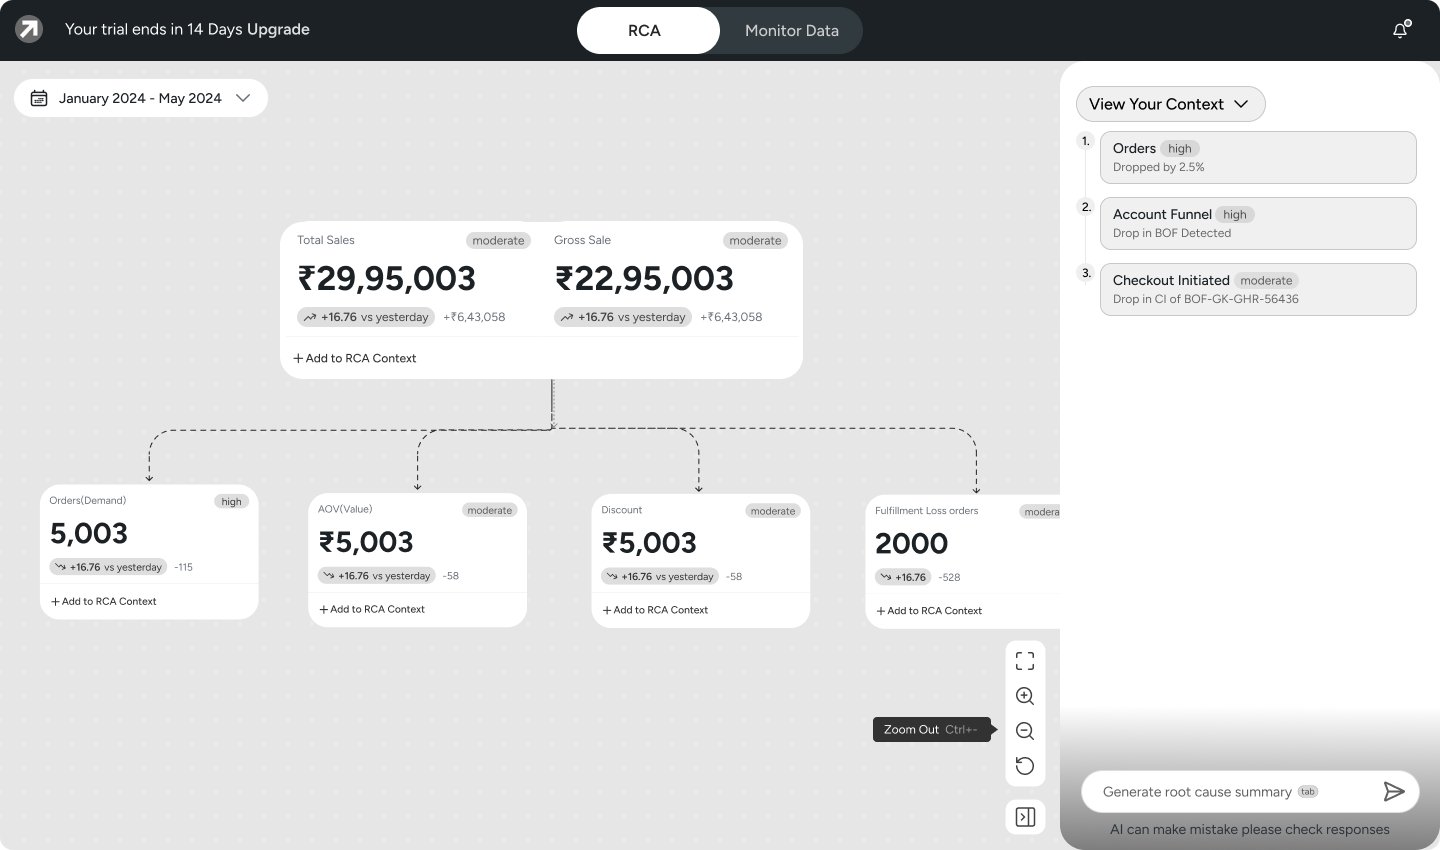
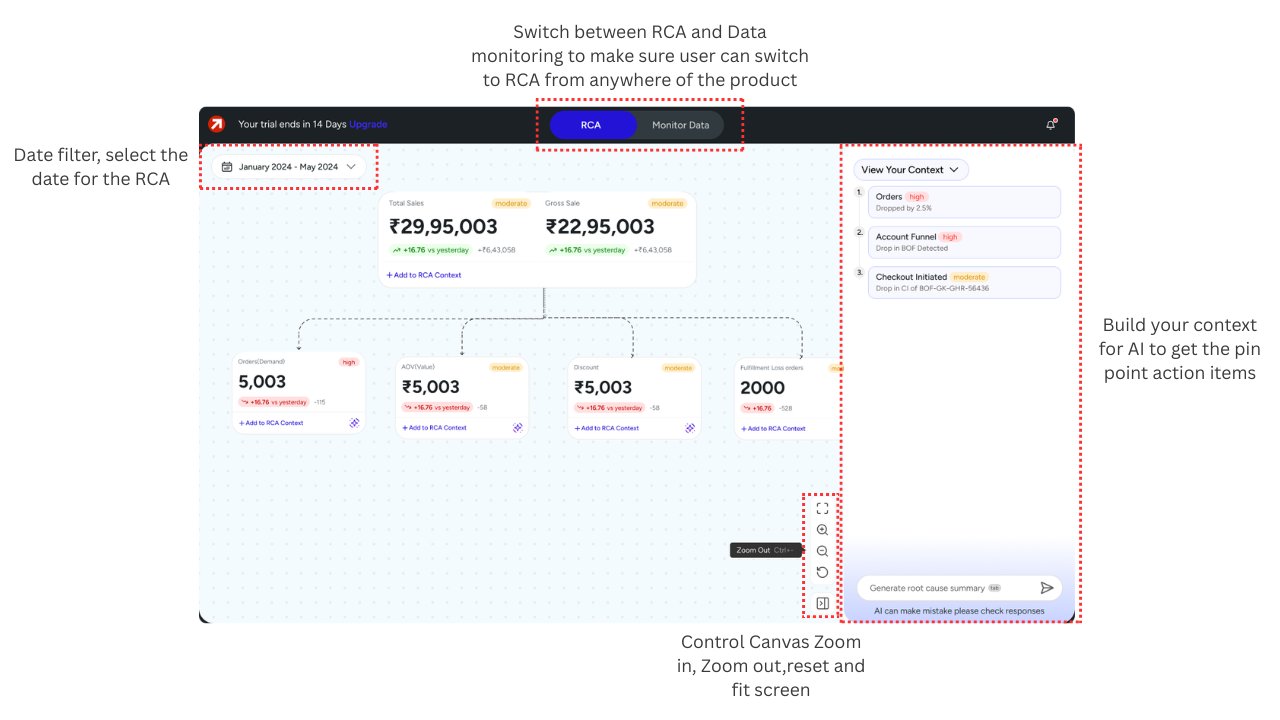
Once the wireframes proved stable, we stepped into high-fidelity UI exploration. This was the exciting moment where Root Cause Analysis finally started feeling like a real, living product.
Everything began coming together beautifully:
● The interactive canvas
● The data nodes
● The step-by-step investigation flow
● The contextual side panels
● The deep drill-down experience
Looking back, the polished final screens were only a tiny fraction of the actual journey. The real heavy lifting happened on dusty whiteboards, torn notebook pages, complex flow diagrams, and during endless, heated debates about how human beings solve business problems.
Ultimately, we didn’t design RCA to be just another passive dashboard.
Join hundreds of D2C brands using Clevrr AI to automate their growth and efficiency.
Join 500+ D2C founders using Clevrr AI to automate their operations and scale faster.
Get Started Free